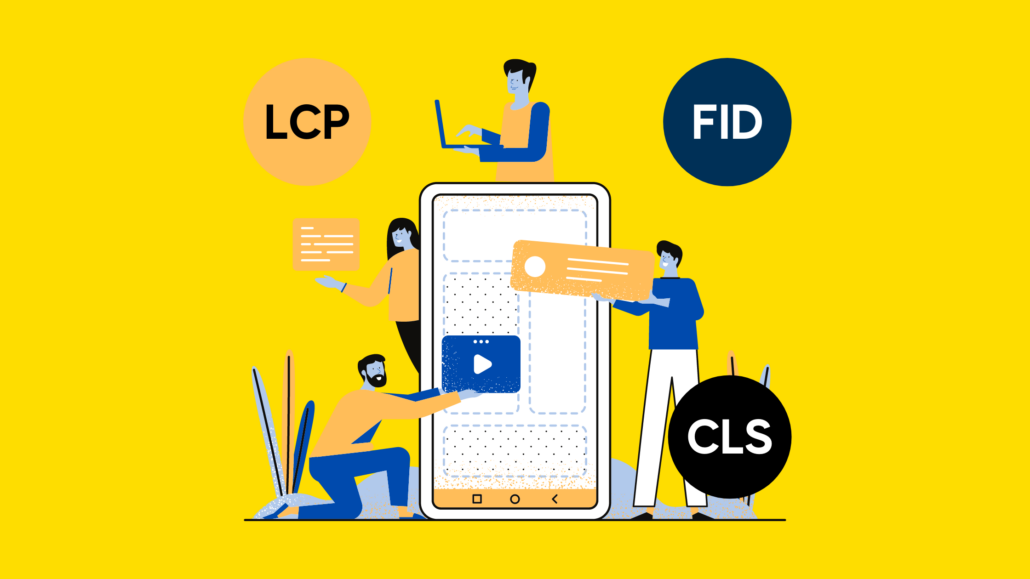
How to Optimise Your Website for Core Web Vitals: LCP, FID & CLS
We’ve recently released a blog post on how to report on Core Web Vitals using the CrUX dashboard in Data Studio. Within that post, we discuss how the CrUX dashboard is an essential tool to use, due to the availability of field data and historical data over the past months to report and monitor your progress to keep in line with Google’s page experience update.
However, that’s only half the story. Now that you have the right tools to provide you with the most accurate data on your site’s Core Web Vital performance, you now need to know how to optimise your website to fall in line with Google’s standards, achieve a positive score and provide a better page experience for your users.
To do so, it is important to establish straight away that the actions that you will need to carry out will require a developer or development team, depending on the size of your website. Since you will need to alter CSS stylesheets, JavaScript script files and other elements pertaining to the programming of a website, You will require the expertise of a developer who knows how to write code and make the changes recommended in this blog post.
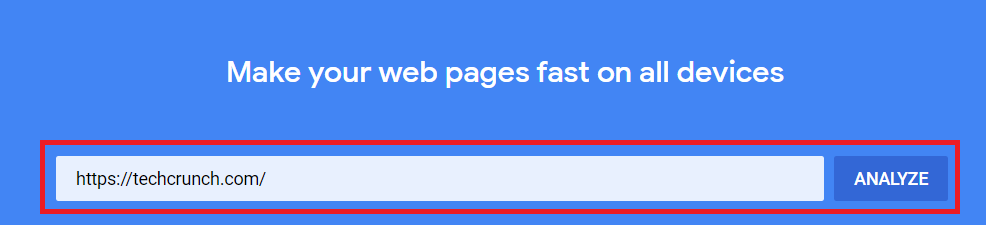
It is also worth pointing out the tools necessary to identify Core Web Vital elements on a web page, before you can actually start the optimisation process. The two most useful tools available are PageSpeed Insights and Chrome DevTools. These platforms are a must-have in your task to improve your Core Web Vitals scores. They are both free, easily accessible and are designed to diagnose Core Web Vital behaviour on a web page.
Now that we know which tools to use to diagnose Core Web Vital issues, we can begin our recommendations to optimise for Core Web Vitals. Let’s start by discussing the first Web Vital, Largest Contentful Paint.
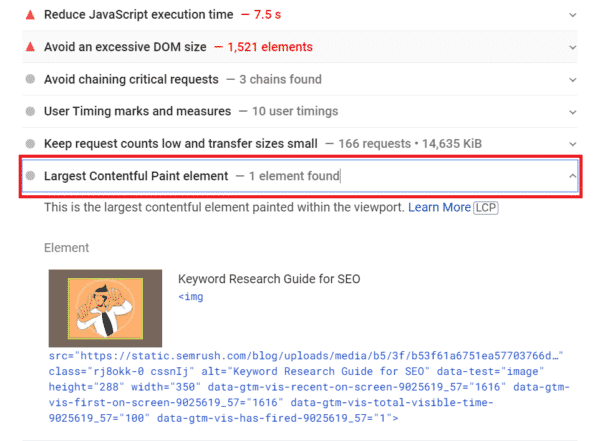
 Once the analysis loads you can scroll down, where you will find a drop-down menu entitled “Largest Contentful Paint element.” Select the drop-down menu. You will be shown the largest contentful paint element on that web page. In the example below, it is a featured image.
 Here are the most common reasons behind a poor LCP score:
 Below are 6 actions you can implement to improve your server response time:
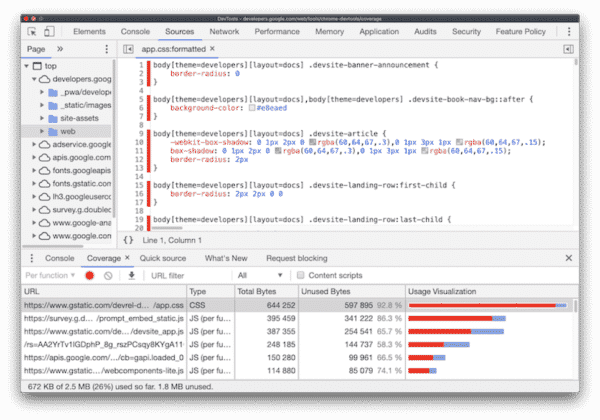 Image credit: web.dev
 Image credit: web.dev
 Image credit: web.dev
Besides compressing image sizes and preloading important resources, there are also other actions that can be implemented to improve slow resource load times:
Image credit: web.dev
Besides compressing image sizes and preloading important resources, there are also other actions that can be implemented to improve slow resource load times:
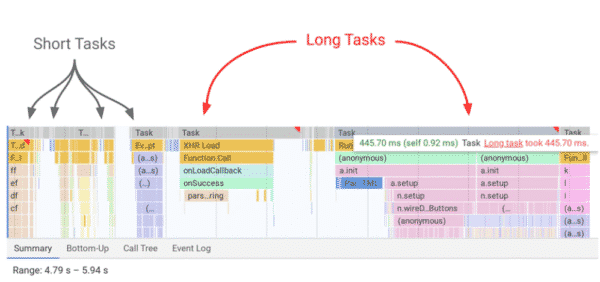 Image credit: web.dev
Long tasks are extended periods of code where JavaScript is executed. These execution periods occupy the main thread for a much longer duration of time, thereby causing the user interface to freeze and become unresponsive. Any piece of code that blocks the main thread for 50 milliseconds or more can be characterised as a long task. Splitting up long tasks into shorter sections of code should help to reduce poor FID.
Image credit: web.dev
Long tasks are extended periods of code where JavaScript is executed. These execution periods occupy the main thread for a much longer duration of time, thereby causing the user interface to freeze and become unresponsive. Any piece of code that blocks the main thread for 50 milliseconds or more can be characterised as a long task. Splitting up long tasks into shorter sections of code should help to reduce poor FID.
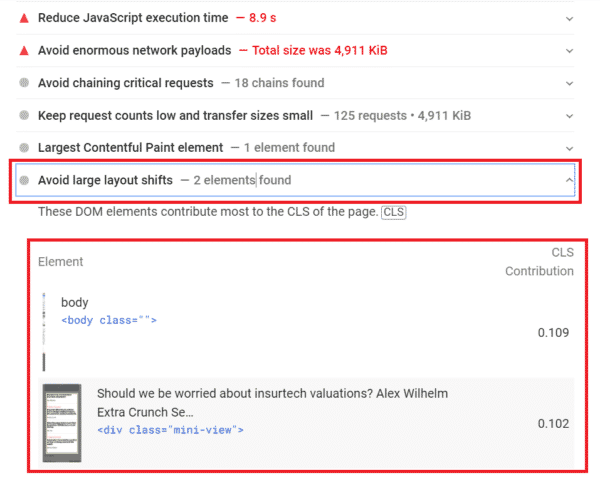
 Once the analysis has loaded, scroll down and this time, select the “Avoid large layout shifts” option. A menu will drop down and display all of the elements on the web page where a layout shift occurred.
 Here are some of the common causes of CLS:
Largest Contentful Paint
There are different elements that can be considered as the largest contentful paint on a web page,- An image, such as the hero or background image
- H1 tag
- A block of text
Once the analysis loads you can scroll down, where you will find a drop-down menu entitled “Largest Contentful Paint element.” Select the drop-down menu. You will be shown the largest contentful paint element on that web page. In the example below, it is a featured image.
Here are the most common reasons behind a poor LCP score:
- Slow server response time
- Render blocking JavasScript and CSS
- Slow resource load time
Slow Server Response Time
If your server takes too long to receive content from a browser, this will directly impact how quickly it can render content for the user, such as images and text, which make up the Largest Contentful Paint on page. Therefore, it is essential to improve your server response time, to in turn improve your LCP score. A good method to identify if your server response time is too slow and is the cause of your poor LCP score is by looking at the historical data of the Time to First Byte metric in the CrUX dashboard. This metric measures how long it takes when a user requests information, or bytes, from your server, to then render the very first byte of your page’s content. It’s a direct measurement of how fast your server responds to a user’s request. If you see that your site consistently gains a poorer rating, over the months, then you will know that your server is responding too slow.
Below are 6 actions you can implement to improve your server response time:
- Optimize your server
- Route users to a nearby CDN
- Cache assets
- Serve HTML pages cache-first
- Establish third-party connections early
- Use signed exchanges
Render Blocking CSS and JavaScript
CSS and JavaScript are inherently render-blocking. This means that when a browser is rendering content on a page, it will pause when it comes across a CSS stylesheet or JavaScript script file. The browser needs to download, parse and execute these files before continuing to render the page. There are several solutions that you can utilise In order to reduce the amount of time blocked by CSS files or JavaScript scripts.How to Reduce CSS Blocking Time
In order to reduce the total amount of time blocked by CSS files you can use the following common tactics:Minify CSS
CSS files contain characters such as spacing, indentation and comments to make the file easier to read. However, these characters are not necessary for the browser to understand the file. Therefore, using minification removes all of these unnecessary characters, which will reduce the size of CSS files as well as blocking time, thereby improving the speed at which LCP can render.Defer Non-Critical CSS
You can remove entirely unused CSS from your web page, or move it to a different stylesheet if it is used on a separate page of your site. You can identify unused CSS by using the Coverage tab in Chrome DevTools.
Image credit: web.dev
Inline Critical CSS
Inline critical CSS that is used for content that will appear in the viewport by including it in the <head> tag of your web page’s code. By doing so, it removes the need to make what is called a round-trip request to fetch critical CSS, which, again, reduces CSS blocking time.How to Reduce JavaScript Blocking Time
Just as you can implement certain strategies to reduce the blocking time of CSS, so can the same be done with JavaScript scripts. Here are a few ways to reduce JavaScript blocking time:Minify and Compress JavaScript files
Minification involves removing whitespace and any other parts of code that is deemed unnecessary for the script file to still be considered a valid and functional series of code. In order to apply minification systematically to your JavaScript files, it is best done with a compression tool such as Terser. Data compression is the act of modifying data with an algorithm for performant servers and client interactions. You can use GZIP, which is the most commonly used compression format as well as many other and newer compression algorithms for even better compression.Defer Unused JavaScript
Similar to how you can defer unused CSS, you can also defer unused JavaScript code by using code splitting. What this means is rather than sending all of your JavaScript to the user at once, you can split up your JavaScript code into smaller segments and then load the pieces of your code that you need for above-the-fold content first. You can also identify how much JavaScript code is not being used on your page by using the Coverage tab from Chrome DevTools, as mentioned previously, to identify unused CSS code
Image credit: web.dev
Minify Unused Polyfills
All site owners want a website that is supported on all browsers. However, the problem lies when you want to use the latest JavaScript features on older browsers that do not natively support those new JavaScript features. This is where polyfills come in. Polyfills are aspects of code that insert the most contemporary functionality to older browsers that do not inherently support those functionalities. It is best to minify unused polyfills. Another common result in low LCP rating is slow resource load time.Slow Resource Load Time
If a browser is slow at loading resources on your page, such as images, videos, text or any other resource, it will have a direct impact on your LCP. Therefore, it is best to optimise the load time of your web page’s resources to improve your LCP score.Optimising and Compressing Images
One such way of improving resource load time is by optimising and compressing images. As mentioned before, images, such as hero or background images are typically the largest element in the viewport. Therefore, it is better to compress and use a smaller size image, rather than one that is 10kb or above, in order to improve the rendering load time of the LCP.Preload Images and Other Resources
Using Preload is an excellent way to optimise the rendering process of images and improve page speed. Preload tells the browser of the more important elements that are hidden away in CSS or JavaScript files, that can often be requested later, to be prioritised and loaded as soon as possible. Many types of elements can be preloaded, but you should focus on applying this strategy on resources like your hero image, which will be one of the first items to appear in the viewport and also what is considered the LCP on your page. There are many types of elements that can be preloaded, but you should prioritise loading essential assets such as fonts included in a stylesheet, hero and background images, or resources loaded from a script, on your page that you want to prioritise in terms of loading.
Image credit: web.dev
Besides compressing image sizes and preloading important resources, there are also other actions that can be implemented to improve slow resource load times:
- Compress text files
- Deliver different assets based on network connection (adaptive serving)
- Cache assets using a service worker
First Input Delay
Unlike LCP, First Input Delay is measured using field data only, since it directly relies on measuring real user interaction on a web page. Therefore, when testing and making changes and updates to your site for FID, you can use the Total Blocking Time metric instead, in the lab. The Total Blocking Time metric measures the total amount of time the main thread, which is where the browser processes most of the tasks pertaining to loading a page, was blocked by a single task, thus not being able to respond to any user interaction as the main thread was still busy processing that particular task. Therefore, improvements in Total Blocking Time will directly correlate with improvements in First Input Delay. The Total Blocking Time metric uses lab data, which makes it ideal for making changes and updates, and then testing those changes in a controlled lab environment, to establish if indeed those changes reduce your total blocking time, before deploying those adjustments to your site in the field. The main cause behind poor FID is heavy JavaScript execution. This means that the browser cannot respond to a user’s input because it is still busy working through the current task of executing JavaScript code, which is occupying the main thread, There are several actions that you can implement In order to reduce the load on the main thread of a browser and in turn reduce a poor FID score:- Break up long tasks
- Optimise your page for interaction readiness
- Use a web worker
- Reduce JavaScript execution time
Break up long tasks
One of the most significant ways to reduce a poor FID score is by breaking up long tasks. This simply means breaking up long-running segments of JavaScript code into smaller parts.
Image credit: web.dev
Long tasks are extended periods of code where JavaScript is executed. These execution periods occupy the main thread for a much longer duration of time, thereby causing the user interface to freeze and become unresponsive. Any piece of code that blocks the main thread for 50 milliseconds or more can be characterised as a long task. Splitting up long tasks into shorter sections of code should help to reduce poor FID.
Optimise Your Page for Interaction Readiness
When it comes to optimising your web page to be ready for user interaction there are three main pitfalls to avoid in order to reduce the load of JavaScript on the main thread and by doing so increase the responsiveness to user interaction:- First party script execution can delay interaction readiness
- Data-fetching can impact many aspects of interaction readiness
- Avoid loading third party scripts, which can delay the response time to user interaction
Use a Web Worker
Since one of the main reasons behind FID is a blocked main thread, a web worker, which is a JavaScript script file that allows you to run your JavaScript code on a background thread, independently of other scripts, without affecting the performance of your page, will ease the load on the main thread and improve input response times. The user is free to click, select and perform other interactions on the web page, while the web worker runs code on a background thread. Examples of web workers that can help to run JavaScript code on a background thread are:- Comlink
- Workway
- workerize
Reduce JavaScript Execution Time
Another method to improve your FID score is to simply reduce the amount of JavaScript executed on your page. To do so, you can use two of the same solutions to reduce JavaScript from your page to help optimise for LCP:- Defer unused JavaScript
- Minimise unused polyfills.
Cumulative layout shift
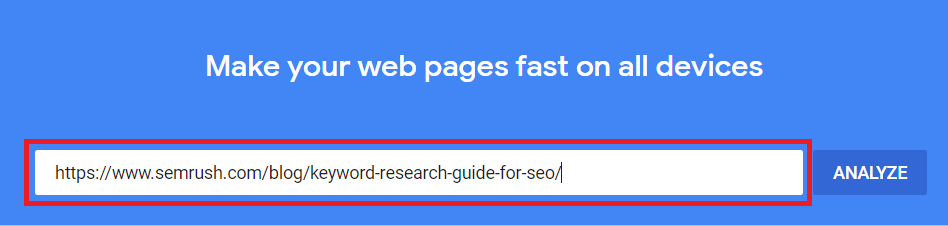
Before delving into the recommended tactics that you can use to improve your CLS score, It is important to first explain that sudden layout shifts on the page that occur within the viewport is what is measured against the CLS metric. This means that only layout shifts that the user experiences on the page is what is taken into account when measuring the CLS score. If a layout shift occurs below the viewport and it has not affected the user’s experience on the page, then that incident of a layout shift is disregarded. As it is the same for LCP you can identify the CLS elements on a page by using PageSpeed Insights or Chrome Developer Tools. To identify CLS using PageSpeed Insights, simply copy the URL of your web page into the address bar.
Once the analysis has loaded, scroll down and this time, select the “Avoid large layout shifts” option. A menu will drop down and display all of the elements on the web page where a layout shift occurred.
Here are some of the common causes of CLS:
- Images without dimensions
- Ads, embeds and iframes without dimensions
- Dynamically injected content
- Web fonts causing FOIT/FOUT
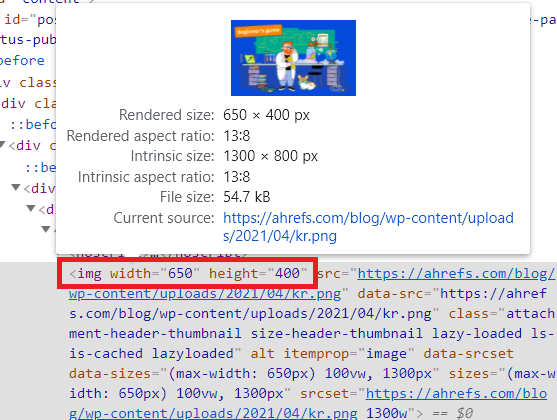
Images without Dimensions
The first common cause of CLS is images without dimensions. To optimise for this issue, make sure to always add width and height attributes to your images. If you prefer you can save the necessary width and height dimensions needed using CSS aspect ratio boxes. Simply by adding width and height elements to your code, the appropriate space on your web page will be allocated to your image when it is loading, preventing any sudden layout shifts from occurring.
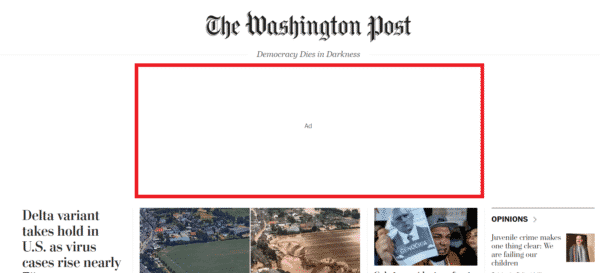
Adverts
Typically, adverts are the main cause for layout shifts on a web page. There are three main reasons as to why an advert can cause a layout shift:- Multisize ads – the size of the ad is not fixed
- Deferred loading – the adverts are loaded much later in the page life cycle.
- Refreshed ads – The advert is refreshed during the user experience
- Using placeholders
- Preloading
- Collapse empty slots
Placeholders
One of the ways to avoid unnecessary layout shifts is to use placeholders to statically reserve space for potential adverts. In order to apply a placeholder for your adverts you can simply use the CSS properties “min-height” and “min-width” to the ad container. Your ad scripts will then be able to connect to the container and insert the ad. If the intended ad is bigger than the space you have allocated, it will be resized to fit within the area specified. But, if the advert is actually smaller or exactly the same size as the placeholder, then no visual layout shift will occur on the page and as a result, reduce your CLS score.