This article was originally posted on the SEmrush Blog – check it out here
How to Estimate Your Organic Traffic Potential for SEO
Understanding the available opportunity within a specific market allows you to create a dialled in SEO strategy, taking actions based on data rather than hunches and gut feelings. This guide will show you how to calculate where your opportunity lies by allowing you to:
Estimate organic traffic by topic within your niche
Estimate organic traffic based on realistic goals
A Quick Disclaimer on Estimating or Forecasting Organic Traffic
Any estimate for a website’s organic traffic potential is going to be based on current and historic data. As a result, you will end up with a fairly accurate estimate of where the opportunity lies for your website right now.
Forecasting future traffic based on the framework provided here is subject to a number of uncontrollable factors, such as search trends, algorithm updates and changes in user behaviour.
What we are looking to create is a snapshot of where your opportunity is right now based on existing rankings, with a means of easily updating your most current data to see where opportunities shift over time. This snapshot of opportunity will show the current growth areas, by topic, alongside a website’s current performance for these topics.
If required, this method of estimating traffic potential can be applied to new opportunities that you don’t currently rank for quite easily.
Getting Started: What Data and Metrics Do I Need?
You need data to build organic traffic estimates. These data points are available in multiple places however they are not all created equal—different tools display the same metric based on various sources. A suggested source for each data point is in the guide below and here is a quick summary of the data we will be using:
First, you will need a list of keywords this should consist of:
Keywords your website already ranks for
Keyword research for new topics that your website does not currently rank for
With each of these keywords, you will need:
Search Volume
This is the key metric for estimating organic traffic and is the only metric within your keyword data that is non-optional for creating an estimate.
Keyword Difficulty
Including keyword difficulty will allow you to have a base understanding of where opportunity is easiest to pursue, enabling prioritisation within an SEO strategy for topic’s with lower competition.
Current Ranking Position
Including this metric will allow you to further prioritise based on where you’re currently ranking for a specific topic, for example it’s probably easier to get onto page 1 if you’re on page 2, rather than in position 50+.
Current Ranking URL
Including this metric will help with grouping and categorising keywords and mapping your SEO efforts to the keyword data. Keyword research generally always benefits from being mapped to landing pages (you will have to add in the suggested ranking URLs manually).
Current Traffic
Including this metric will show the growth available for a certain topic, if you’re already performing quite well you might want to address the underperforming categories/topics first.
Search Intent
Including this metric will allow you to take this guide a little further and create opportunity estimates based on the CTR influences of different search intents. For example phrases with an informational intent may have higher click through rates than commercial phrases.
That covers the data to be included with your keyword research. You will also need:
Click Through Rates (CTR)
To estimate traffic potential rather than just going off total search volumes you will need CTR data. Ideally based on positions 1 through to 20.
Search Volume Data: Understanding Your Source (Semrush vs GKP vs GSC)
Arguably, the most important metric for gauging organic traffic potential is the search volume data assigned to your keyword data. Understanding your source for this data will allow you to be more informed when creating a strategy based on your opportunity analysis:
Semrush Search Volume Data
Semrush uses machine learning algorithms and a huge database of search engine data to calculate search volumes. Their calculation process for search volumes consists of:
Overlaying existing data sets with historical clickstream data from reliable sources
Using this set of data, Semrush then creates a computational model
This model is then applied to the keyword data to provide search volumes for the keyword set
Google Search Console is one of the two sources of keyword search volume data that we can get directly from Google. It’s generally accepted that GSC provides incredibly accurate search volume data. For example, if your page ranks on the first page of Google for a selected term the impressions you see in GSC should accurately match the search volume for that keyword.
For this use case though, GSC isn’t all that useful as it won’t highlight the traffic potential for your page 2 positions. On top of that, there are a few additional factors that can influence the accuracy of search volume data from GSC:
Bot traffic can impact impressions
For local results, search volumes will vary greatly depending on the location the landing page is serving
In most use cases these factors are fairly negligible as GSC is still widely regarded as one of the best resources for accurate search volume data for keywords that you rank on page 1 of Google for.
Google Keyword Planner (GKP)
Google Keyword Planner on the other hand is fairly well known for being less accurate when it comes to search volume data. This is mainly due to the fact that it tends to group very similar keywords together and rounds up search volume data. As a result, this usually means that the search volume figures you see in Google Keyword Planner are overestimated. GKP still has plenty of useful applications, but for this use case it can provide inaccurate results.
Step by Step Guide to Estimating Organic Traffic Potential for SEO
Now we have covered the expected outcome and data sources, let’s jump into the step by step guide to gauge your realistic organic traffic potential using Semrush.
Gathering the Data (& Keyword Research)
To start, you will need a list of keywords that your website currently ranks for alongside their ranking URL, current positions and search volume. To get this, we are using the Semrush Organic Research tool:
As this is based on opportunity, we recommend filtering out page 1 positions and setting the position filter from 2 to 40.
Then add a keyword filter to exclude branded terms from showing in the list. You can also filter by URL if you want to exclude certain areas of your site from the final opportunity data.
Export this data into a CSV or Excel file (your preference), then rename the only tab with data in it to “Keyword Data.”
Grouping and Organising the Keyword & Search Volume Data
To effectively estimate your organic opportunity for a topic within your chosen niche you will need to categorise your keywords and their search volume data into groups.
To start, let’s clean up the exported data and remove the columns we won’t be using:
Previous position
CPC
Traffic %
Traffic Cost
Number of results
Trends
Timestamp
We won’t be using SERP features or Keyword Intents in this guide but, as mentioned above, it’s useful to keep these if you would like to enhance your data past the point of where this guide takes you. Also, at this point, feel free to manually remove any anomalies from your keyword list.
Then add a new column titled “Category.” This column will be used to categorise your keywords. To populate this column, you can manually enter a category alongside each keyword or you could save time and take an easier approach by using your ranking URLs. Unfortunately, this approach is highly dependent on your URL structure.
Grouping Keywords by Ranking URL
This is probably the easiest and fastest way to create category labels for your keywords. As mentioned above, this method only works if you have a specific type of URL structure that clearly defines parent and child categories..
In the steps below we will cover creating categories from your Ranking URLs for each keyword. To provide a reference point, we will be using the following URL as an example: www.exampledomain.com/products/product-category/product-name
Copy your entire URL column into the new “Category” column
Do a Find (CTRL + F) or (CMD + F) and refine the selection to your category column
Enter your full domain and any parent categories that come before your topic category e.g. www.exampledomain.com/products/ and replace this with nothing, this will remove the first part of your URL and leave you with /product-category/product-name
Then do the same for anything after your topic category, in this case it’s /product-name
Now, if necessary, do a find and replace on the same column for any hyphens or separating characters with a space. So in this case product-category becomes product category
You should now have a column filled with “categories” based on your ranking URLs you can then use an =PROPER formula to change these values to the correct case e.g. Product Category
When using this method, it’s sometimes useful to create two category columns; one parent category and one sub-category. It’s entirely up to you and your forecasting needs, but for the purpose of keeping this simple the guide above just covers creating one category.
Setting Realistic Ranking Position Goals
Now we need to set realistic ranking position goals for all of the keywords in the sheet. Your sheet should have keywords that you already rank for in-between position 2 and 40 so the opportunity should be set on realistic goals.
The steps below cover a recommended approach for setting ranking position goals but feel free to change up the position estimate brackets based on the time horizon of your objectives:
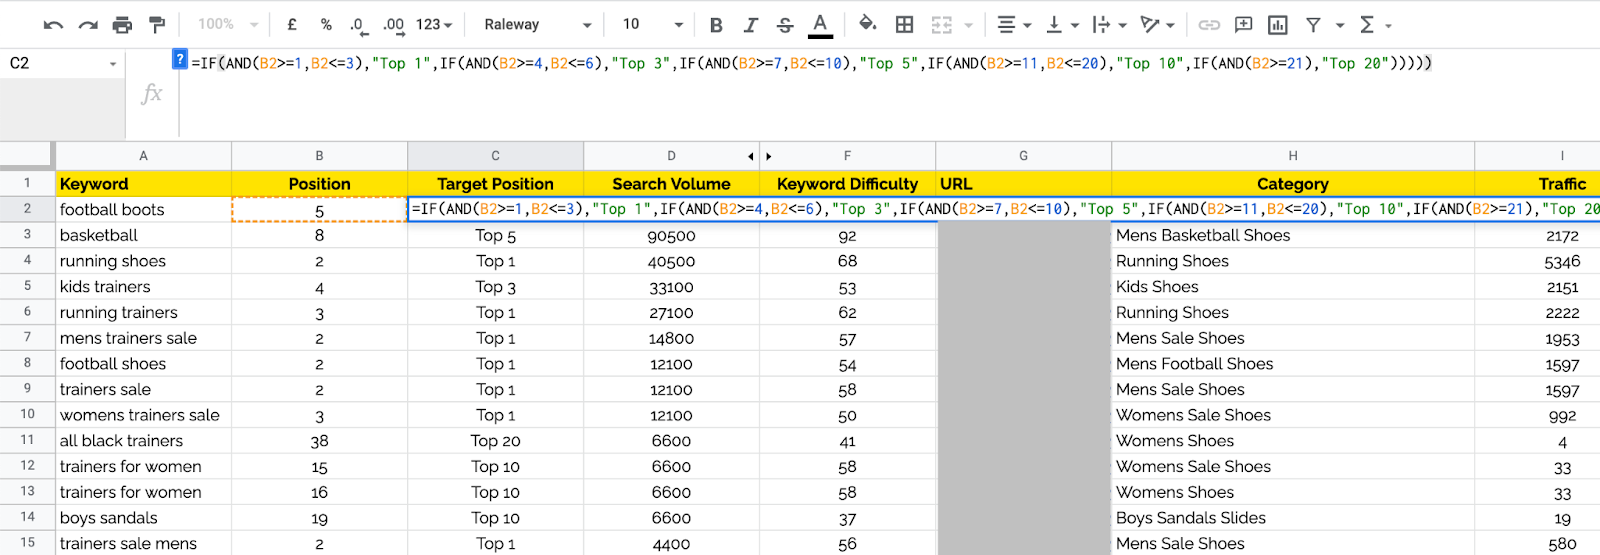
Create a new column next to Current Rank called “Target Position”
In the first cell place this formula: =IF(AND(B2>=2,B2<=3),”Top 1″,IF(AND(B2>=4,B2<=6),”Top 3″,IF(AND(B2>=7,B2<=10),”Top 5″,IF(AND(B2>=11,B2<=20),”Top 10″,IF(AND(B2>=21),”Top 20″)))))
Where the formula references “B2”, make sure you change this to refer to the first cell in your Current Rank column
Now drag this formula down to cover all rows containing data
This formula will then set target positions for all of your keywords based on their existing position. For example in the above formula the target position brackets are set as follows:
Current Rank
Target Rank
2 to 3
Top 1
4 to 6
Top 3
7 to 10
Top 5
11 to 20
Top 10
21+
Top 20
Calculating Expected Traffic on a Keyword Level
Now it’s almost time to calculate your expected traffic based on your target position and search volume data on a keyword level. But first, you will need to get some click-through rate data. For this guide, I will be using Advanced Web Rankings CTR data.
When collecting your CTR data, it’s important to take into consideration the intent of the terms which you are estimating organic traffic potential for. This is because click-through rates vary based on the search intent, so to keep your data as accurate as possible it’s important to match the right click-through rates with the search terms intent. In the example below, we are just using commercial intent CTRs to keep things simple for the sake of demonstration.
Create a new tab in your sheet, call this “CTR Data”
In this tab, create a table similar to the one below and populate it with CTR data from your chosen source. You can do this across a range of intents but in this example, we’re keeping it simple and using just one CTR for commercial intent and assuming all our keywords are commercial in nature:
Now you have all your CTR data, we can create an estimate of the traffic expected for each keyword by using a formula that simply calculates Search volume x CTR for your target position.
For this next set of steps, go back to your keyword data tab and:
Create a new column next to your Search Volume called “Traffic Potential”
In the first cell in the “Traffic Potential” column, place the following formula =IF(AND(C2=”Top 1″),D2*’CTR Data’!$B$7,IF(AND(C2=”Top 3″),D2*’CTR Data’!$B$2,IF(AND(C2=”Top 5″),D2*’CTR Data’!$B$3,IF(AND(C2=”Top 10″),D2*’CTR Data’!$B$4, IF(AND(C2=”Top 20″),D2*’CTR Data’!$B$5)))))
Ensure all the cell references in the formula match your dataset In the example above:
C2 = Target Rank
D2 = Search Volume
‘CTR Data’ !$B$X = CTR data
Drag this formula down across your entire column. This will calculate the available traffic for your target rank
This is a fairly simple example. You can take this further by adding in different click through rates for multiple intents and also taking into account expected clicks per search before applying the click through rates.
Bringing It All Together
Now for the fun part which, as you might have guessed, does include some more formulas. We are now going to create a reporting tab to summarise all of our opportunity data into categories, resulting in a table that will look like this:
Create a new tab in your spreadsheet and call it whatever you like this time, something like “Traffic opportunity by category” will work if your imagination is failing you
In this sheet, create a table with the following column titles:
Category
Keyword count
Existing annual traffic
Annual traffic potential
Additional traffic opportunity
Annual search volume
In the Category column, copy and paste your categories from your keyword data tab and de-duplicate them so you have one unique reference for each topic or category
Now all that is left to do is populate the data summaries for each category using the formulas below as a guide:
Column
Formula
Keyword Count
=COUNTIF(Category column in keyword data tab,Category cell in current tab)
Existing annual traffic, Annual traffic potential and Annual search volume
=SUMIFS(Relevant data column in keyword data tab, Category column in keyword data tab,Category cell in current tab)*12
Additional traffic opportunity
=Existing annual traffic-Annual traffic potential
Once your summary is completed, you can bring a visual aspect to the data with bubble charts and graphs. A bubble chart is a great way to highlight the range of opportunity within your set of categories, allowing you to “zoom in” by excluding cells from the range:
Using a stacked bar chart, you can stack both the existing traffic and additional traffic opportunity to highlight the gap:
These visual charts allow you to gain a top-level overview of your organic traffic potential, without having to sift through rows and rows of data.
Making Best Use of the Traffic Potential Data
Now you should have a solid understanding of where your organic traffic opportunities lie. Remember, the outcome of this activity is only as good as the strategy it’s being used to inform—it will show you where the opportunities lie but not what it will take to acquire those new positions.
While it may be tempting, don’t just go after the biggest numbers first. Take a look at all of the topics within your opportunity analysis and create a prioritised list based on the effort required to achieve the positions and the potential return.
To understand the effort required to rank in your niche we would suggest completing a full competitive analysis on a topic level. This will allow you to truly understand what it will take for you to rank in your target positions. When completing your competitor analysis it’s worth breaking down the winning strategies within each topic. As it will likely show you the scope of investment required to compete.
By overlaying your competitor analysis with your organic traffic forecast you can create a well-informed action plan for increasing your organic ranking positions.