How to Analyse Brand & Non-Brand Organic Traffic

Reporting on organic traffic is one of the most fundamental metrics in SEO. It is one of the key indicators on how your site is performing and informs the recommendations that are a part of your overall strategy. However, one of the most basic missing elements to our traffic data is how much of our organic performance is based on queries that are brand related or from non-brand related terms.
This guide will show you:
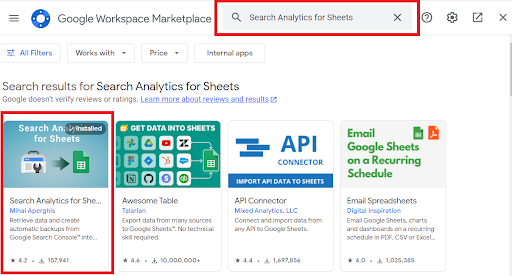
 A new window will open. Search for the “Search Analytics for Sheets” add on in the search bar and then select the extension once it appears.
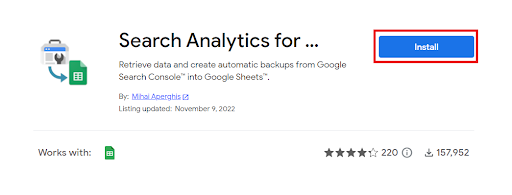
 Afterwards, select the Install option.
 The extension should then be installed as part of Google Sheets and you are ready to use it to extract your data.
Now that we understand what tools we are going to be using and where our data is coming from, Let’s move on to understand what data and metrics we will need for our brand and non-brand analysis.
The extension should then be installed as part of Google Sheets and you are ready to use it to extract your data.
Now that we understand what tools we are going to be using and where our data is coming from, Let’s move on to understand what data and metrics we will need for our brand and non-brand analysis.
 You will find that a sidebar will have loaded on the right-hand side of the screen.
 Now that the sidebar has loaded, you can then start to configure the settings to what best suits what you are reporting on.
You can set the start and end dates to the range of your choice but bear in mind that if you set the date range for an extended period, such as 6 months, the amount of data that would be requested may be considerable and difficult to load (it could potentially cause Sheets to stop working or for the data to be extracted unsuccessfully). Therefore, for the purpose of this guide, as well as best recommended practice, we suggest loading a month’s data at a time.
2. So, in this example, we will set the date range for the month of October 2022.
Now that the sidebar has loaded, you can then start to configure the settings to what best suits what you are reporting on.
You can set the start and end dates to the range of your choice but bear in mind that if you set the date range for an extended period, such as 6 months, the amount of data that would be requested may be considerable and difficult to load (it could potentially cause Sheets to stop working or for the data to be extracted unsuccessfully). Therefore, for the purpose of this guide, as well as best recommended practice, we suggest loading a month’s data at a time.
2. So, in this example, we will set the date range for the month of October 2022.
 3. Once you have set the date range, leave the “Search Type” option as web.
 4. Finally, for the “Group By” setting, select the “Date”, “Query” and “Page” options, in this order. It is important that the options are selected in this order, as this will make it easier to organise and segment the data later on.
 So far these are all the settings that we need to be concerned about in order to extract the data we need to segment between brand and non-branded traffic. We can leave the rest of the settings as they are. All that we need to do now is select the “Request” option.
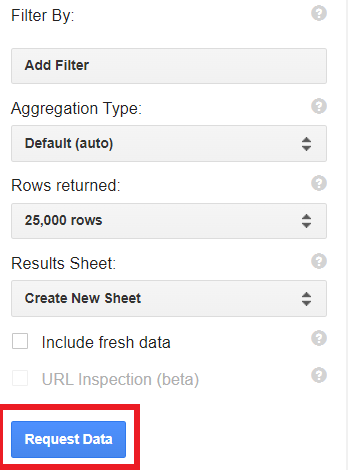 After you select the “Request Data” option you will find that a new tab will emerge with your data loading in it. You will get a message in the bottom right-hand corner of the screen informing you when all the data has been extracted successfully.
The sheet will have the “Date”, “Query” and “Page” data on the left along with the corresponding clicks, impressions, and position for each query, and from which page and date they occurred.
After you select the “Request Data” option you will find that a new tab will emerge with your data loading in it. You will get a message in the bottom right-hand corner of the screen informing you when all the data has been extracted successfully.
The sheet will have the “Date”, “Query” and “Page” data on the left along with the corresponding clicks, impressions, and position for each query, and from which page and date they occurred.
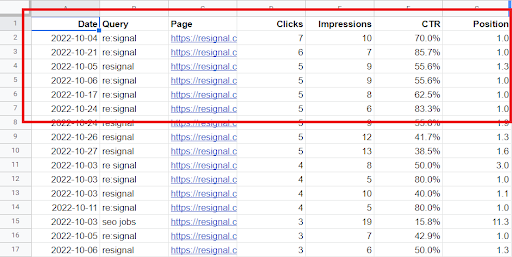 However, one of the first things you will notice when you look at the data is that it is not organised by date, but rather by query and page. Therefore, it would be difficult to summarise how many clicks, both branded and non-branded, occurred on each date, for each query. And subsequently for each month (if you are reporting on other months too).
Now that your data has successfully loaded you can then start to group and segment the data based on brand and non-branded keywords.
However, one of the first things you will notice when you look at the data is that it is not organised by date, but rather by query and page. Therefore, it would be difficult to summarise how many clicks, both branded and non-branded, occurred on each date, for each query. And subsequently for each month (if you are reporting on other months too).
Now that your data has successfully loaded you can then start to group and segment the data based on brand and non-branded keywords.
 Now that we have the prerequisite dates within the tab, we can then start using the existing formulas to populate the rest of the columns with traffic data.
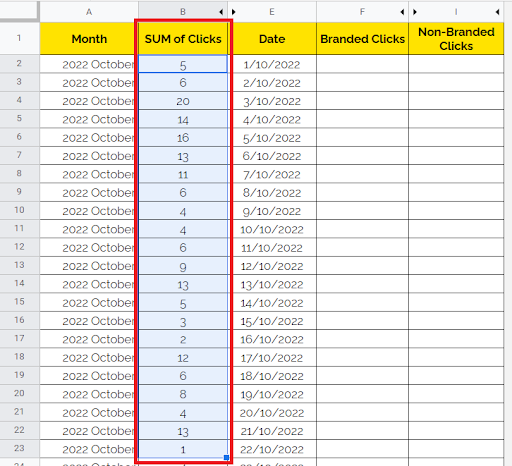
The first data column we need to fill in is the “SUM of Clicks” column. This column will summarise all of the clicks for each of the queries that were achieved, on every date, in the month of October. We can use a simple SUMIFS formula to carry this out.
What the existing SUMIFS formula will do is summarise all of the clicks, in column D of the 2022 10 tab, that occurred on every date in the month of October. This is collated from column A, from the 2022 10 tab, and then uses the corresponding date in each cell of column E, from the reporting tab, as a reference.
Now that we have the prerequisite dates within the tab, we can then start using the existing formulas to populate the rest of the columns with traffic data.
The first data column we need to fill in is the “SUM of Clicks” column. This column will summarise all of the clicks for each of the queries that were achieved, on every date, in the month of October. We can use a simple SUMIFS formula to carry this out.
What the existing SUMIFS formula will do is summarise all of the clicks, in column D of the 2022 10 tab, that occurred on every date in the month of October. This is collated from column A, from the 2022 10 tab, and then uses the corresponding date in each cell of column E, from the reporting tab, as a reference.
 After the SUMIFS formula has been executed, just like for the “Month” and “Date” columns, drag the formula down to the bottom of the tab. This should have returned the total number of clicks that occurred for each date of the month.
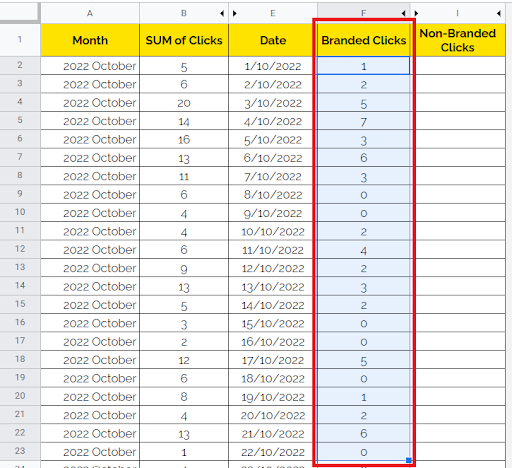
 At this point the data will include the total number of clicks from branded and non-branded terms. The next column we work on, “Branded Clicks”, will segment the data based on clicks from branded search queries.
 Once your formula has been updated successfully and the correct amount of clicks are being extracted, you can then simply drag the formula to the bottom of the sheet. You should then have the number of clicks from branded queries from each date of the month.
 As usual, simply drag the formula down to the end of the rows. Your column should be entirely populated with the number of non-branded clicks from each corresponding date.
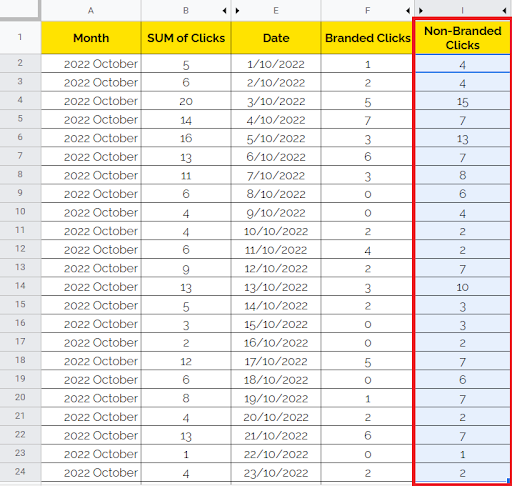 You now have the total number of branded clicks and non-branded clicks for each date of the month of October. Of course the total sum from each column will give you the total number of branded clicks and non-branded clicks from the month as a whole. So for example, from our dummy data, for the month of October, 71 clicks were branded as compared to 204 clicks which were from non-branded search terms.
At the moment, you will have a top line brand and non-brand overview of your traffic for the month of October. But you can go even further granular in your analysis and segment your data depending on the different types of pages you have on your site.
You now have the total number of branded clicks and non-branded clicks for each date of the month of October. Of course the total sum from each column will give you the total number of branded clicks and non-branded clicks from the month as a whole. So for example, from our dummy data, for the month of October, 71 clicks were branded as compared to 204 clicks which were from non-branded search terms.
At the moment, you will have a top line brand and non-brand overview of your traffic for the month of October. But you can go even further granular in your analysis and segment your data depending on the different types of pages you have on your site.

 These criteria are based on the common subfolder designation that can be found on eCommerce sites for either category pages or product pages.
If your website sits on the Shopify CMS then your category pages will most likely have a “/collections/” subfolder designation to identify it as a product category page, or a “/products/” subfolder for product pages.
For other online retailers, especially those that are sports brands and are on the Sales Force Commerce Cloud CMS then your category pages will have a “/c/” designation to identify it as a category page, and “/p/” to denote a product page. Therefore, you can simply replace the “/collections” or “/products/” criteria with either a “/c/” or “/p/” criteria instead.
These criteria are based on the common subfolder designation that can be found on eCommerce sites for either category pages or product pages.
If your website sits on the Shopify CMS then your category pages will most likely have a “/collections/” subfolder designation to identify it as a product category page, or a “/products/” subfolder for product pages.
For other online retailers, especially those that are sports brands and are on the Sales Force Commerce Cloud CMS then your category pages will have a “/c/” designation to identify it as a category page, and “/p/” to denote a product page. Therefore, you can simply replace the “/collections” or “/products/” criteria with either a “/c/” or “/p/” criteria instead.

 After populating these columns, you will now have not just brand and non-brand data to your site overall, but also how much of that data is to category and product pages.
We could leave the analysis here and simply represent the data as a column chart, illustrating how much traffic each different brand and non-brand segmentation gained for the single month of October. However, if you want to enrich the data you’re about to analyse by tracking the fluctuations in brand and non-brand traffic for not just a single month, but throughout the year, or potentially comparing it to the previous year too, then we can go a few steps further by:
After populating these columns, you will now have not just brand and non-brand data to your site overall, but also how much of that data is to category and product pages.
We could leave the analysis here and simply represent the data as a column chart, illustrating how much traffic each different brand and non-brand segmentation gained for the single month of October. However, if you want to enrich the data you’re about to analyse by tracking the fluctuations in brand and non-brand traffic for not just a single month, but throughout the year, or potentially comparing it to the previous year too, then we can go a few steps further by:
 Of course, if your website includes category and product pages then your master sheet will also include the brand and non-brand clicks to category and product page columns from the reporting tab, of the individual monthly reporting sheets.
 Within these tables, you will be able to summarise and see the total number of brand and non-brand clicks to the site as a whole.
And if you are also analysing traffic to collections and product pages, then the total amount of brand and non-brand traffic can be summarised for those pages each month as well.
(If you choose to extend your data set to the previous year as well, you can then also see a year on year comparison for each month too, which will enrich your data to another height, by adding a comparison level. But bear in mind, the Search Analytics for Sheets extension can only collect data from a prior 16 months. So you may not be able to collect the data for the whole of last year).
To summarise the months data for brand and non-brand clicks to the site as a whole, product pages and collection pages, you can use a simple SUMifs formula that uses the data from the master reporting sheet. We’ll use clicks to the whole site as an example:
Within these tables, you will be able to summarise and see the total number of brand and non-brand clicks to the site as a whole.
And if you are also analysing traffic to collections and product pages, then the total amount of brand and non-brand traffic can be summarised for those pages each month as well.
(If you choose to extend your data set to the previous year as well, you can then also see a year on year comparison for each month too, which will enrich your data to another height, by adding a comparison level. But bear in mind, the Search Analytics for Sheets extension can only collect data from a prior 16 months. So you may not be able to collect the data for the whole of last year).
To summarise the months data for brand and non-brand clicks to the site as a whole, product pages and collection pages, you can use a simple SUMifs formula that uses the data from the master reporting sheet. We’ll use clicks to the whole site as an example:
 Within the formula above, the column for non-branded clicks is summarised for the month of October.
 A time series chart is useful to understand how your traffic is behaving and how your site is performing in terms of branded and non-branded split of traffic share, over an extended period, such as the year so far. As mentioned, this will help you to understand how your site performs for branded terms in contrast to non-branded terms.
It will certainly help to make your reporting that much more granular and precise. You will be able to track how your site performs more accurately and insightfully too.
A time series chart is useful to understand how your traffic is behaving and how your site is performing in terms of branded and non-branded split of traffic share, over an extended period, such as the year so far. As mentioned, this will help you to understand how your site performs for branded terms in contrast to non-branded terms.
It will certainly help to make your reporting that much more granular and precise. You will be able to track how your site performs more accurately and insightfully too.
- How to extract search Google Search Console query data directly into Google Sheets using the Search Analytics for Sheets extension
- Segment the data into brand and non-branded traffic
- Present the data in a way that is most useful to you and your clients.
Getting started
What tools will you need
To start, we need to know what tools are required to split the data into brand and non-brand traffic.Google Sheets
First and foremost you will be using Google Sheets, which is completely free for any user. It goes without saying, but this is the most crucial tool as you will be using sheets to do all of your reporting and analysis. You also need Sheets, over any other spreadsheet application, like Excel, as you will need to use the Search Analytics for Sheets extension, which is not available for Excel. As mentioned before, this tool will directly pull data from Google Search Console into Sheets, surpassing the 1k query limit, without any difficulty.Google Search Console
Speaking of Google Search Console, the second tool you will need to use is indeed Google Search Console. Make sure you have access to your client’s GSC account, or to your own account if you are working in-house. Since Search Analytics for Sheets is extracting data directly from Google Search Console, having access to this platform is essential. This tool will show us what queries you are organically ranking for, from which pages and on which date.Search Analytics for Sheets
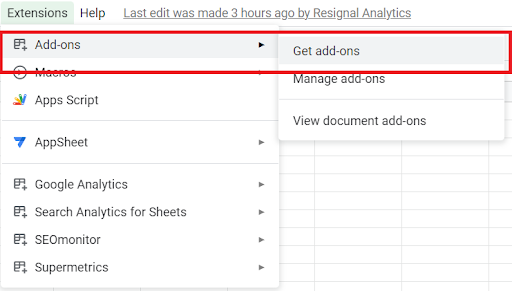
And finally, you of course need to have access to the “Search Analytics for Sheets” extension, within Google Sheets. To add this extension, simply open a new Google Sheets file, then navigate into the “Extensions” tab and select the “Get Add Ons” option from the “Add Ons” drop down menu.
A new window will open. Search for the “Search Analytics for Sheets” add on in the search bar and then select the extension once it appears.
Afterwards, select the Install option.
The extension should then be installed as part of Google Sheets and you are ready to use it to extract your data.
Now that we understand what tools we are going to be using and where our data is coming from, Let’s move on to understand what data and metrics we will need for our brand and non-brand analysis.
What data will you need
As previously mentioned, the data that the tool will be drawing from is directly from Google Search Console. When we load the data into Sheets directly, we will have 7 metrics : 1. Date This dimension is essential to know on what day each query, your website ranked for. This will be important when we want to summarise our brand and non-brand data by month, for example, or any other date period, depending on your chosen date range. If we have brand and non-brand data every month, we can then track how our site is performing for each metric.2. Query
The query data is the most important item of data we will be using. Without this data, we will not be able to segment our traffic into brand and non-brand attributions, as the segmentation of brand and non-brand is based on what brand and non-brand queries you are ranking for.3. Page
This metric will be especially useful when it comes to segmenting your brand and non-brand traffic from the different page types live on your website. If you do decide to take a more granular approach and want to identify how much traffic is going to your category or product pages, for example, then this metric is vital to have, as we can use the “/collections/” or “/product/” subfolder designation to filter for those pages only, within our analysis.4. Clicks
Aside from the query data, the clicks metric will be the other most crucial element within this entire analysis. This metric is what we will base our traffic on. Hence, it will also inform our brand and non-brand traffic as well. With this data, we will be able to see how much branded and non-branded traffic occurred on each date and each month, depending on the date range you choose. The other 3 metrics that will be loaded into Google Sheets are:- Impressions
- CTR
- Position
Collecting your data
How to collect the data in Search Analytics for Sheets
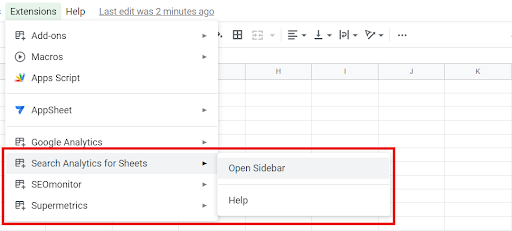
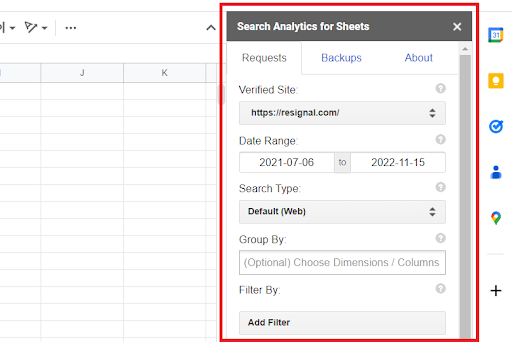
- To begin, open a new Google sheets document and from the “Extensions” tab on the toolbar, select “Open Sidebar” from the “Search Analytics for Sheets” option:
You will find that a sidebar will have loaded on the right-hand side of the screen.
Now that the sidebar has loaded, you can then start to configure the settings to what best suits what you are reporting on.
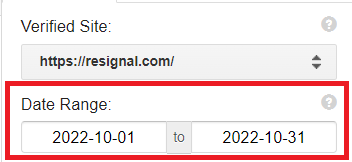
You can set the start and end dates to the range of your choice but bear in mind that if you set the date range for an extended period, such as 6 months, the amount of data that would be requested may be considerable and difficult to load (it could potentially cause Sheets to stop working or for the data to be extracted unsuccessfully). Therefore, for the purpose of this guide, as well as best recommended practice, we suggest loading a month’s data at a time.
2. So, in this example, we will set the date range for the month of October 2022.
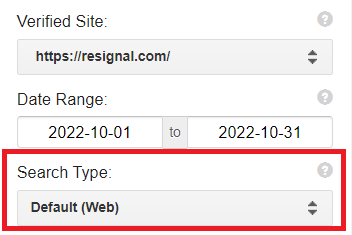
3. Once you have set the date range, leave the “Search Type” option as web.
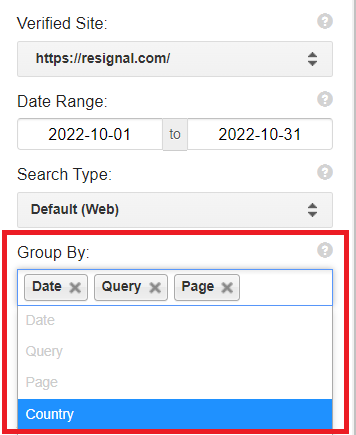
4. Finally, for the “Group By” setting, select the “Date”, “Query” and “Page” options, in this order. It is important that the options are selected in this order, as this will make it easier to organise and segment the data later on.
So far these are all the settings that we need to be concerned about in order to extract the data we need to segment between brand and non-branded traffic. We can leave the rest of the settings as they are. All that we need to do now is select the “Request” option.
After you select the “Request Data” option you will find that a new tab will emerge with your data loading in it. You will get a message in the bottom right-hand corner of the screen informing you when all the data has been extracted successfully.
The sheet will have the “Date”, “Query” and “Page” data on the left along with the corresponding clicks, impressions, and position for each query, and from which page and date they occurred.
However, one of the first things you will notice when you look at the data is that it is not organised by date, but rather by query and page. Therefore, it would be difficult to summarise how many clicks, both branded and non-branded, occurred on each date, for each query. And subsequently for each month (if you are reporting on other months too).
Now that your data has successfully loaded you can then start to group and segment the data based on brand and non-branded keywords.
Organising the data for Reporting
Renaming the tab by date
The next step is to rename the tab, with all of your data, to something more memorable and easy to read. It is best not to rename the tab to something generic, such as “sheet 1”. Rather, try to provide a name like “keyword data” or by month, such as “October data”. For this guide, we’ve gone for “2022 10” as the example name. This will help when you start to implement formulas to summarise the data within the tab.Creating a new “Reporting” tab for segmentation
After naming your tab appropriately, you now want to start organising your data by date and subsequently into branded clicks and non-branded clicks. To do this, you want to create a new sheet. This will be the tab where you summarise all of the data, from the “2022 10” tab, into branded and non-branded clicks. In other words, this will be your reporting tab. Within your reporting tab, you will want to have 9 columns. Each will be used to summarise a section of the data from the GSC queries tab, by date. You will want columns with the following headings:- Month
- SUM of Clicks
- Date
- Branded Clicks
- Branded Clicks for Product Pages
- Branded Clicks for Collections Pages
- Non-Brand Clicks
- Non-Brand Clicks for Product Pages
- Non-Branded Clicks for Collection Pages
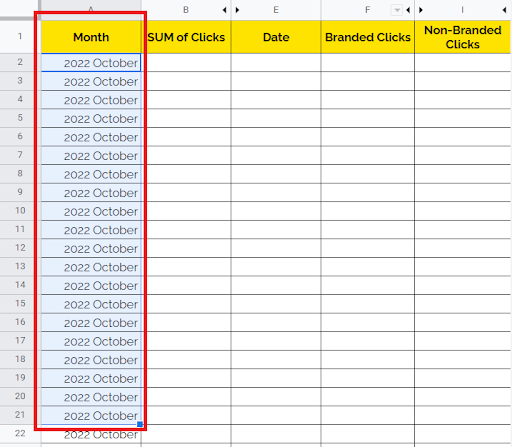
Organising the data by month
Within the first column, “Month”, you will want to have the chosen month and year you are reporting on. In our case, it is the month of October in the year 2022. Fill the “Month” column with this value, “2022 October”, for each corresponding date in that month. So for the month of October, there were 31 days, so, in total there should be 31 rows, and each row should have the “2022 October” value within the “Month” column.
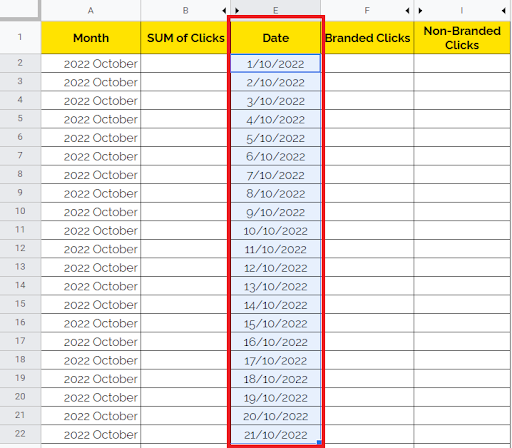
H3: Organising the data by date
The next column you want to update is the “Date” column. This column is just as simple as the “Month” column. You want to have each date from the month to populate each one of the 31 rows within the tab. To do this, you can simply use Google’s DATE function. Write out the first date of the month in a standard day, month, year syntax and then just drag the cell down to the bottom. It should look something like this:
Now that we have the prerequisite dates within the tab, we can then start using the existing formulas to populate the rest of the columns with traffic data.
The first data column we need to fill in is the “SUM of Clicks” column. This column will summarise all of the clicks for each of the queries that were achieved, on every date, in the month of October. We can use a simple SUMIFS formula to carry this out.
What the existing SUMIFS formula will do is summarise all of the clicks, in column D of the 2022 10 tab, that occurred on every date in the month of October. This is collated from column A, from the 2022 10 tab, and then uses the corresponding date in each cell of column E, from the reporting tab, as a reference.
At this point the data will include the total number of clicks from branded and non-branded terms. The next column we work on, “Branded Clicks”, will segment the data based on clicks from branded search queries.
Segmenting the data into brand and non-brand
Segmenting the branded traffic
For the “Branded Clicks” column, our SUMIFS formula will need to be slightly modified. This time you will want to add your brand name at the end of the formula in speech marks. This will inform Google to identify only those clicks that occurred on the specific date, from queries related to your brand.
Segmenting the non-branded traffic
To calculate the non-branded share of clicks is much more easy. No fancy formulas required this time. There is a simple subtraction formula in the “Non-Branded Clicks” column, which calculates the remaining number of clicks after the number of branded clicks has been taken away from the total number of clicks. As an example, it subtracts the value of branded clicks in cell F2 from the value of total clicks in cell B2.
You now have the total number of branded clicks and non-branded clicks for each date of the month of October. Of course the total sum from each column will give you the total number of branded clicks and non-branded clicks from the month as a whole. So for example, from our dummy data, for the month of October, 71 clicks were branded as compared to 204 clicks which were from non-branded search terms.
At the moment, you will have a top line brand and non-brand overview of your traffic for the month of October. But you can go even further granular in your analysis and segment your data depending on the different types of pages you have on your site.
Segmenting the brand and non-brand traffic to category and product pages
For eCommerce sites, you may have your most important pages split into category or collections pages and product pages. Therefore, you might also want to see how much brand and non-brand traffic went to your category pages as compared to your product pages. In order to identify this further, granular segmentation of traffic, you will need to use the formulas in the following columns:- Branded Clicks for Product Pages
- Branded Clicks for Collections Pages
- Non-Branded Clicks for Collection Pages
- Non-Branded Clicks for Product Pages.
Segmenting branded traffic to product and collections pages
Firstly, they include the data from the “Page” column of your queries data tab, as well as a “/collections/” or “/products/” search criteria.Formula for branded clicks to product pages
Formula for branded clicks to collections pages
Segmenting non-branded traffic to product and collection pages
The formulas in the “Non-Brand Collections Pages” and “Non-Brand Product Pages” are relatively similar except for one slight difference. At the end of the formula where your brand name and similar variants are mentioned, opening and closing brackets, “<>” are included. These additions will exclude queries, from category or product pages, that are related to your brand.Formula for non-brand traffic to product pages:
Formula for non-brand traffic to collections pages:
- Repeating this process for other months
- Creating a master reporting view
- Creating a brand and non-brand split of traffic overview sheet
Enriching your data set by increasing the date range
Let’s say you want to expand the data set to have a wider range to analyse. We can take the full year to date as an example. For example, from January 2022 to October 2022. There are two ways to do this:- The first, is to increase the date range, from the settings, in the Search Analytics side bar
- The other is to extract the data separately for each month and repeat the reporting process every time.
Creating a master reporting sheet
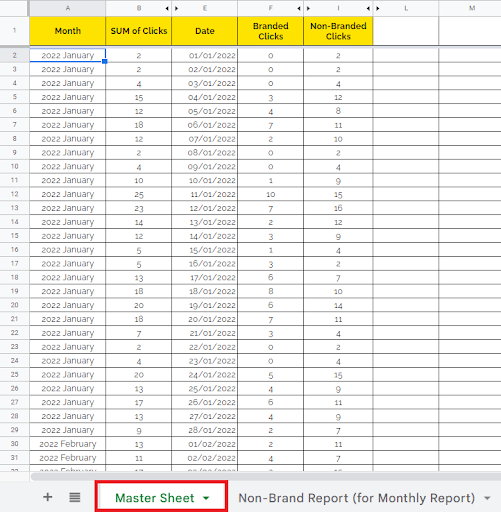
If you have chosen the second method, which is the recommended option, in this guide, you will then want to copy all of your data, from each of the individual monthly sheets, as values into a master reporting sheet. All of your data will sit in this sheet from January 2022 to October 2022. Your master reporting sheet should look something like the example below:
Of course, if your website includes category and product pages then your master sheet will also include the brand and non-brand clicks to category and product page columns from the reporting tab, of the individual monthly reporting sheets.
Creating a brand and non-brand monthly overview
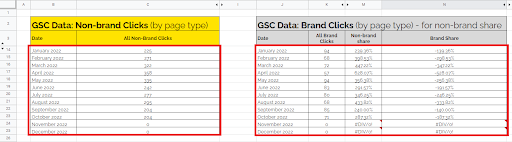
Once you have created your monthly reporting sheet, you will then want to create a new “brand and non-brand split of traffic” sheet. Create this sheet in a different tab, within the same spreadsheet as your master reporting sheet. Your “brand and non-brand split of traffic” tab will contain two separate tables. One for non-brand data and the other for brand data.
Within these tables, you will be able to summarise and see the total number of brand and non-brand clicks to the site as a whole.
And if you are also analysing traffic to collections and product pages, then the total amount of brand and non-brand traffic can be summarised for those pages each month as well.
(If you choose to extend your data set to the previous year as well, you can then also see a year on year comparison for each month too, which will enrich your data to another height, by adding a comparison level. But bear in mind, the Search Analytics for Sheets extension can only collect data from a prior 16 months. So you may not be able to collect the data for the whole of last year).
To summarise the months data for brand and non-brand clicks to the site as a whole, product pages and collection pages, you can use a simple SUMifs formula that uses the data from the master reporting sheet. We’ll use clicks to the whole site as an example:
Representing your data visually for the best insights
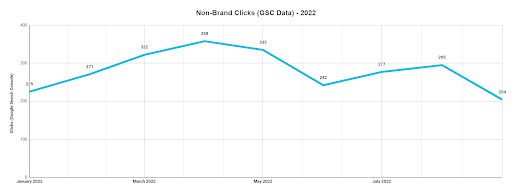
It’s up to you how you want to represent the data visually to best pull insights to inform your strategy. In this guide, we’ve chosen to use a time series chart to best show the increase and decrease in branded and non-branded traffic throughout the year, and pinpoint the changes in specific months.Time series chart for non-branded traffic
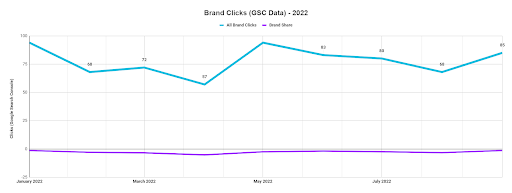
Time series chart for branded traffic
A time series chart is useful to understand how your traffic is behaving and how your site is performing in terms of branded and non-branded split of traffic share, over an extended period, such as the year so far. As mentioned, this will help you to understand how your site performs for branded terms in contrast to non-branded terms.
It will certainly help to make your reporting that much more granular and precise. You will be able to track how your site performs more accurately and insightfully too.