When AI Overviews officially rolled out across the EU, we knew measuring its impact through third-party means would be complex, but the exercise itself revealed insights far more valuable than any single metric. This research examines what happens when you attempt to quantify AI Overviews’ impact using available tools, and why the measurement challenges themselves tell us everything about where search is heading.
The search landscape is evolving faster than our measurement tools can track. While this analysis provides actionable and some strategic insight, it also reveals why traditional approaches to performance measurement are becoming obsolete due to complexity and limitations, and what that means for how we optimise for visibility in 2025 and beyond.
Why did we want to do this?
When AI Overviews began appearing consistently, we knew it wouldn’t be long for our clients to start raising legitimate questions:
- Are we losing clicks to AI generated answers in Google?
- Which query types are most affected?
- Does this impact revenue?
- How should we adjust our strategy?
Sure enough, the questions came thick and fast, and not just from SEO stakeholders. As the key role brand has to play in influencing LLMs & AIO visibility became more apparent, brand and communications teams began positioning themselves as AI owners, influencing the strategy and budget allocations and applying pressure to SEO teams.
Meanwhile, we observed impression growth like never before, while click-through rates (CTRs) declined significantly. With so many unknowns when it comes to AI-focused metrics and tracking, we knew our clients needed real, actionable data, not speculation.
Methodology & caveats:
Google Search Console doesn’t yet provide an AI Overviews filter, and while this feels like it’s either by design, or due to Google itself being limited in getting accurate information around it, we need a methodology.
Our approach settled on identifying which ranking keywords triggered AI Overviews through Semrush, then cross-referencing this data with Google Search Console performance metrics. While straightforward conceptually, this methodology surfaces several challenges:
- Data constraints: Semrush imposed a 30,000 keyword cap (we developed workarounds), the analysis was limited to desktop queries only, and query matching between GSC and Semrush achieved less than 50% overlap due to Google’s anonymisation protocols.
- Seasonality and innovation in SERPS: Seasonal fluctuations could not truly be accounted for and the continuous evolution of the search landscape with AI Overviews/AI Mode rollouts complicated the analysis.
These limitations don’t invalidate our findings, but reflect the reality every SEO team faces now when measuring performance & impact accurately.
Data collection & analysis
We monitored the presence of AI Overviews over a 12-month period. We knew they started appearing months before the official March 2025 rollout, but their adoption accelerated dramatically after May 2025. Interestingly, our client’s volume of total ranked keywords also increased by about 20% compared to the September 2024 baseline.

The share of organic keywords that triggered an AI Overview grew from 1.5% in September 2024 to approximately 32% by September 2025. This represents a major shift, as nearly one-third of organic ranking keywords now trigger AI Overviews in search results.
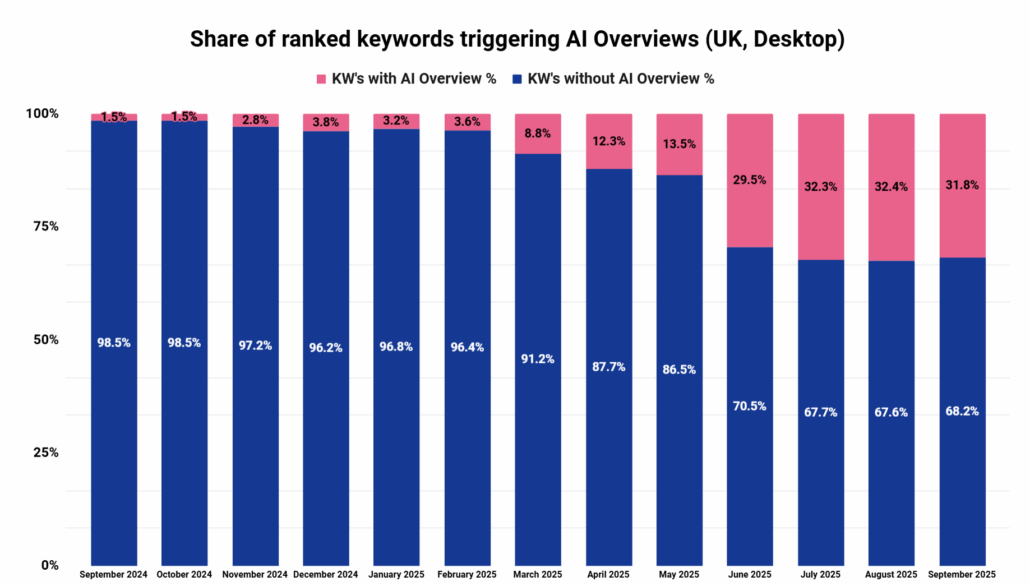
The steepest growth occurred between June and July 2025, suggesting expanded query coverage. Following this, the growth stabilised and remained at similar levels through August, indicating a peak adoption point.
Data points
To analyse this evolution and impact around it, we focused on three key months:
- September 2024 (Baseline): Represented the pre-official rollout period, with only about 1.5% of keywords triggering an AI Overview.
- May 2025 (Inflection Point): Two months after the AI Overviews EU launch, we saw the first major jump to 13.5% of keywords triggering the feature.
- August 2025 (Peak Adoption): By this point, nearly 32% of our client’s keywords were triggering AI Overviews, representing a mature state of the feature.
Our rankings within AI Overviews:
Measuring ranking within AI Overviews themselves was exceptionally challenging due to the limited and mismatched data. Despite these limitations, we observed a consistent growth ratio across both keywords triggering AI Overviews where we weren’t ranking, and those now triggering AI Overviews where we ranked within them. The growth rate for both keyword sets was 96% from September 2024 to August 2025.
However, the absolute visibility picture tells a different story.

The share of keywords ranking within the AI Overview format remained consistently below 4% throughout this period. This is despite one-third of the brand’s keywords now triggering AI Overviews; visibility within that format remains limited.
What we found out:
Despite the data’s complexity, some clear patterns emerged:
AI Overviews are very inconsistent
AI Overviews exhibit a significant level of volatility that is not a normal fluctuation in search results. We found that 69% of queries that triggered an AI Overview in September 2024 dropped out of the comparison set by May 2025. Similarly, another 63% dropped out between May and August 2025.
When we cross-referenced this with performance data, the patterns were even more telling, for instance we saw a 16% increase in impressions in the first period, but a -21% drop in the second. This demonstrates a continuous, real-time shift in which existing AI Overview-eligible queries drop off and new ones emerge. It feels as if Google is learning and training its algorithms to change SERPs in real-time, making consistency in reporting nearly impossible.

Win or lose impressions, you always lose on clicks
When we could track consistent queries, the patterns were contradictory and pointed to a significant loss in clicks.

Between September and May, we saw a 16% increase in impressions for AI Overview-triggering queries, yet clicks dropped 33% for the same queries. Our content was being seen more, but clicked on less. This pattern continued from May to August, where impressions decreased by 21%, and clicks continued their downward trend, dropping another 18%.
This client data aligns with broader industry findings, where independent studies have shown that the presence of AI Overviews correlates with significant drops in organic CTRs, with some analyses showing declines as high as 32-40% for top-ranking pages.
The conclusion is clear: whether you gain or lose impressions, you are losing clicks.
Shift from broader informational content towards commercial
One of the most interesting findings emerged when we looked at which top pages / sub-folders were seeing the most impressions and clicks. The shift wasn’t random, it was strategic, at least from Google’s perspective.
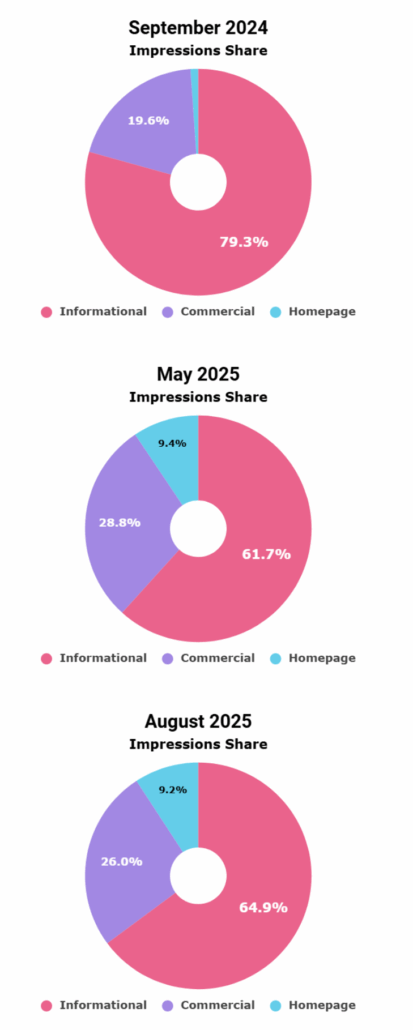
In September 2024, impressions were heavily concentrated on our informational content, but by May 2025 and August 2025, there was a clear shift towards our commercial subfolders and the homepage, reducing the informational share.
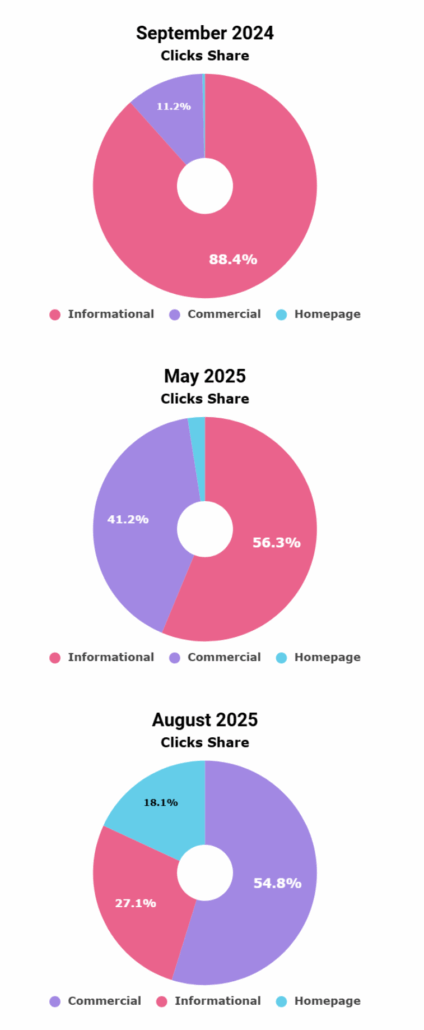
The same pattern emerged in clicks but with a more aggressive shift. In September 2024, they were overwhelmingly directed to informational content, but by May and August 2025, clicks landing on commercial pages and the homepage had taken a majority share, suggesting strong brand recognition was funneling users there even from broader queries.
Adapting to the new reality of Search today
The search landscape is changing has changed, and so should the definition of success be. Our research confirms that the biggest challenge isn’t a drop in a specific metric, but the difficulty in accurate performance measurement itself, given the constant volatility of search results, SERP features such as AI Overviews etc. The shifting nature of the data, and Google making changes to its scraping limits, makes historical measurement questionable and traditional month-over-month reporting less reliable.
Despite these measurement challenges, several clear patterns emerged that can generally be regarded as a learning for those wanting success within AI Overviews:
Shift in traffic intent: What began as a feature mostly for informational queries is now significantly impacting traffic patterns. Our data shows a clear shift in user engagement/intent away from purely informational content and toward commercial pages. Furthermore, it’s driving more traffic to the homepage, rewarding strong brand authority in the space. This challenges the common belief that AI Overviews primarily impact top-of-funnel or informational content and has massive implications for how businesses manage their online presence.
Impact on click-thru-rates: The CTR impact is significant, as our data confirms that you are losing clicks whether you gain or lose impressions, a finding that aligns with previous industry studies showing drops of 32-40% in click-through rates.
Search is everywhere: While a coordinated, multi-channel approach has always been critical for a brand’s success, the emphasis on this strategy is now higher than ever before. Brands must prioritise a “visibility everywhere” approach to build brand perception, which ultimately drives revenue across their channels. This requires a higher level of collaboration where teams like Paid Search, Brand & Comms, etc. work together to elevate the brand’s presence everywhere.
We may not know the true impact of AI Overviews until Google provides an official filter in Search Console, but this complexity is a competitive advantage. Curated results like AI Overviews and tailored responses from LLMs such as ChatGPT, AI Mode, and Perplexity signal a future where traditional SEO metrics, particularly clicks, no longer fulfill the organic measurement criteria.
With our knowledge of how search works, how LLMs and curated search are coming into play, and our experience navigating and improving visibility within both the traditional search and the new answer spaces, we SEOs are uniquely positioned to own this medium. By providing insights and direction to all channels and using our tools and expertise to decipher complex data, we can help other departments move beyond traditional metrics and focus on building a strong, pervasive brand presence that ultimately drives growth.